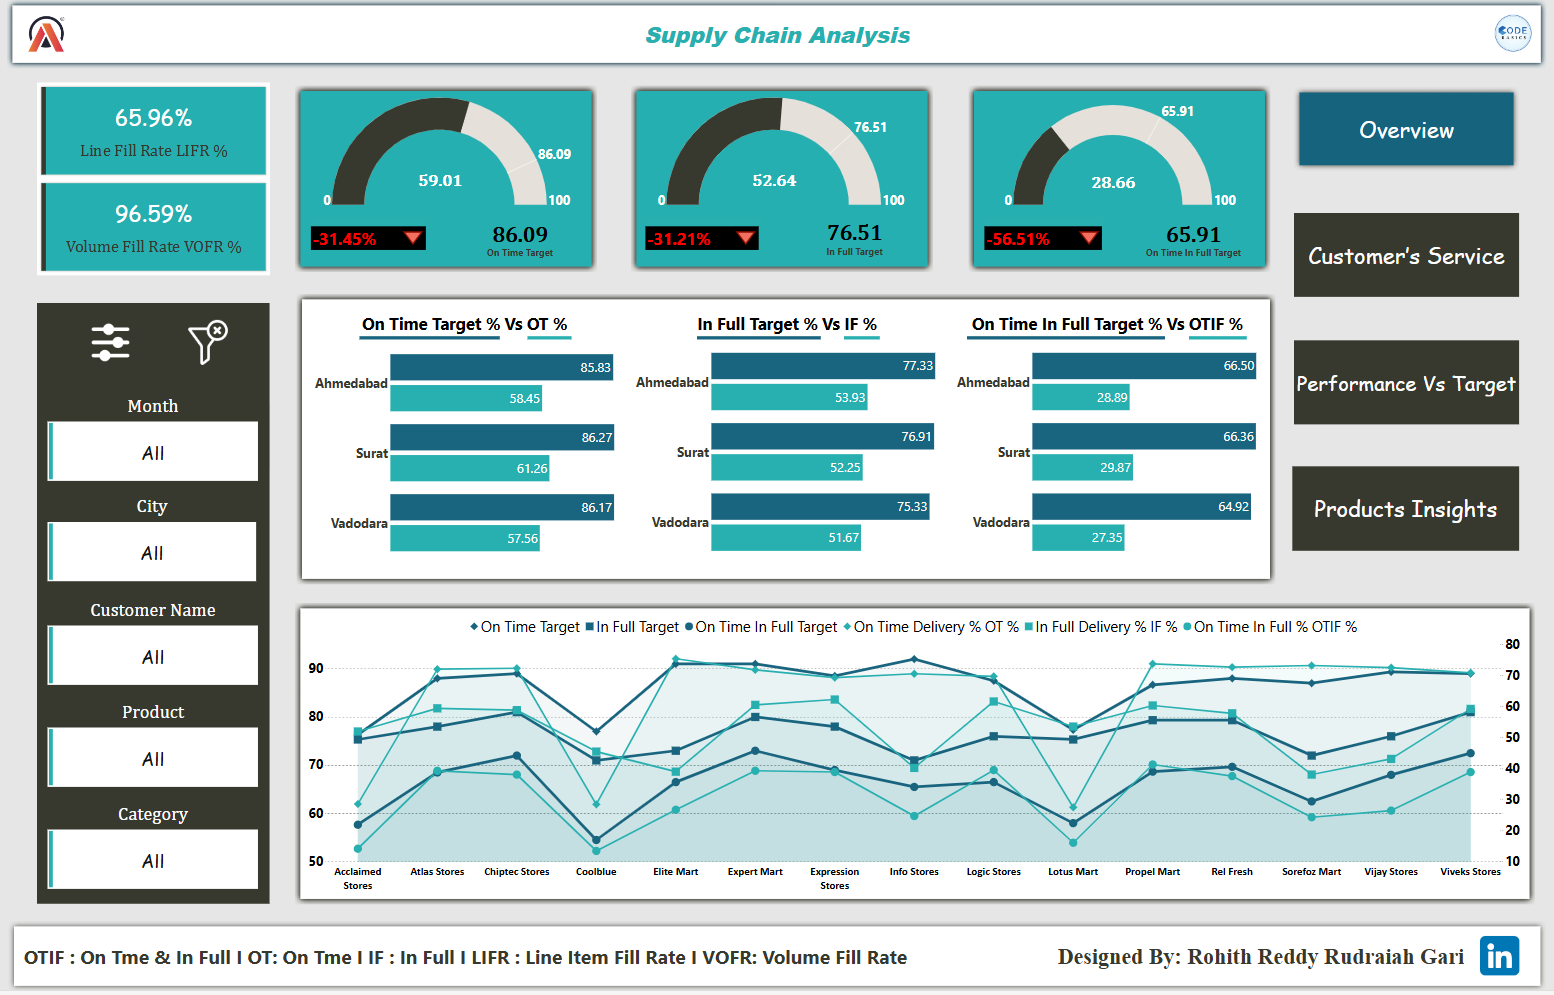
Recent graduate with a B.Tech. in Computer Science & Engineering from CMR College of Engineering & Technology, seeking to leverage my academic knowledge and project experience in data analysis to contribute to data-driven decisions. I am passionate about turning data into actionable insights and excited to bring my skills in statistical analysis and data visualization.
0 + Projects completed
Passionate about turning data into actionable insights and excited to bring my skills in statistical analysis and data visualization.
Grade: First class.
CGPA: 7.51
Grade: First class distinction.
AGGREGATE: 93.2 %
Below are the Data Analytics projects on Excel, Power BI, MySQL & Python.

2

9

5

3  
βAnalyzed retail data, uncovering $10.67M in revenue from 6M units sold, with $9.85M generated on weekdays ππ°. Identified a 30.69% revenue surge in November and a 57.68% decline in December, highlighting key seasonal trends ππ. Found top-performing customers and regions, with Customer 14646 contributing $280K, while the Netherlands ($285K) and Ireland ($283K) led in revenue ππ΅. These insights help businesses optimize strategies, improve marketing efforts, and maximize sales performance ππβ
βπ Conducted a comprehensive analysis of city-level performance, focusing on trip volume, pricing efficiency, and passenger satisfaction. π Identified seasonal patterns and demand variations between weekdays and weekends, while π exploring repeat passenger behavior and loyalty trends. π― Delivered actionable insights to enhance monthly target achievements for trips and passenger ratings.β
"In a project for AtliQ Mart, I analyzed key supply chain metrics (π¦ OTD %, OTIF %, Line Fill Rate) and developed an interactive Power BI dashboard π». By leveraging advanced bookmarks, slicers, and DAX formulas, I boosted navigation efficiency by 25% π and improved report accuracy by 15% π."
βThe focus was to uncover critical insights for an automotive company planning to launch EVs in India.These insights offer a data-driven foundation for launching and scaling EVs in India, helping to navigate this dynamic and fast-evolving market.β ππ
βThe analysis explored critical cricket statistics, including aggregate runs, batting averages, bowlerβs economy rates, and the percentage of dot balls. Additionally, it examined team performances over the years, providing valuable insights for both fans and experts.β ππ
βThe Telangana Tourism Dashboard offers a detailed snapshot of the regionβs tourism, spotlighting Hyderabad, and ranks districts by growth rates. It also forecasts tourist counts and industry earnings.β π
"Utilizing data from the T20 World Cup 2022, my goal was to pinpoint the standout Batters, Bowlers, and All-Rounders, considering a range of performance categories."ππ
"Create an all-encompassing weekly dashboard for credit cards, offering real-time visibility into critical performance metrics and trends. This will empower stakeholders to effectively monitor and analyze credit card operations."πͺπ
βIn this HR Analytics project, I analyzed employee attrition using Python and MySQL on a Kaggle dataset. Key insights showed higher attrition among non-trained employees (53.82%) and the Executive Office (66.67%). The project explored department-wise trends, hiring patterns, and work-life balance, aiding HR in data-driven retention strategies.β
βπ The 2023 Call Center Report reveals $96,623 from 1,000 calls π° over 1,498 minutes β±, with an average rating of 3.89 β and 307 five-star ratings βββββ. Rep R03 earned $20.9k π. Peak times were April and October π , busiest on Wednesdays π. Cleveland had the most male callers π₯. Ratings were mostly 4 and 5 stars π, crucial for boosting efficiency and satisfaction π.β
βAn Excel dashboard was created for the Women's Premier League (WPL) 2024 π, showcasing top performances with the bat and ball. The dashboard features an interactive filter, allowing users to view stats for specific teams, making it easy to analyze and compare player performances across the league π.β
βThe Consumer Goods Ad-Hoc Insights highlights key metrics for a consumer goods company. "Atliq Exclusive" operates in several APAC countries π, with a 36.33% growth in unique products π from 2020 to 2021. Notebooks and Accessories dominate π», while Desktops saw the highest growth (214.29%). Retailers contributed 73.22% of sales π°, and Flipkart led in discounts π.β
βI analyzed historical data to offer revenue insights to the AtliQ Grand hotel team, with the goal of improving revenue and market share relative to other hotels.β ππ¨
βThis project aims to provide people with insights into the COVID-19 situation in their country, allowing them to identify areas where the virus is spreading rapidly and enabling informed planning.β
Below are the Certifications which i gained in various technologies.
Below are the details to reach out to me!
Kamareddy, India